History of High Performance Computing in Cambridge
| Cambridge-Cranfield HPCF > Information for Users > Usage Data |
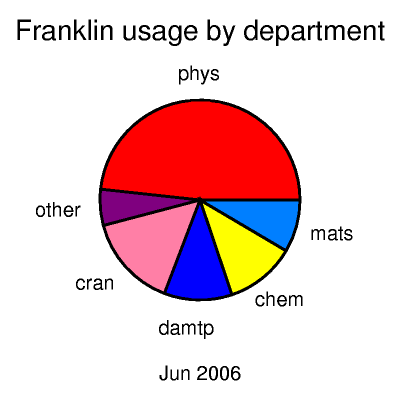
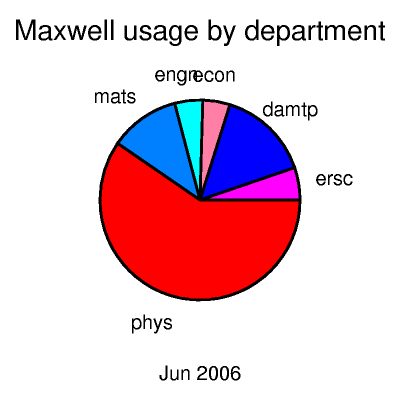
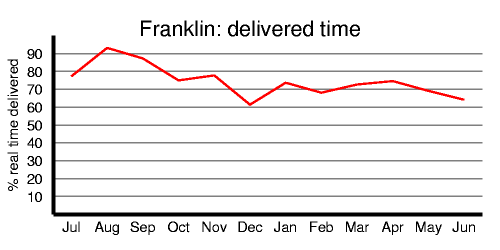
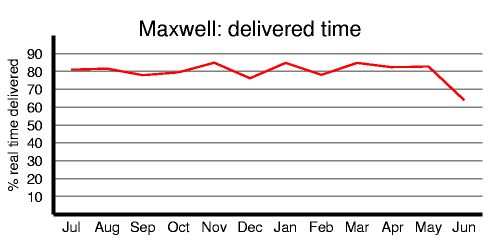
The HPCF is used and funded by different departments to varying extents. Below are graphs of the usage of the two main systems over the past month, followed by total delivered CPU time. Further figures may be provided in due course.
Last month's usage of the SUN cluster by department was as follows:

^M Last month's usage of the Opteron cluster by department was as follows:

Key to abbreviations

bchem  Biochemistry
chem   Chemistry
damtp  Applied Maths and Theoretical Physics
engn   Engineering
ersc   Earth Sciences
irc    Interdisciplinary Research Centre in Superconductivity
med    Medical Sciences
mats   Materials Science and Metallurgy
phys   Physics
system System work
Totals under 4% are grouped under "other".
The following graph shows the amount of time delivered to user applications over the past twelve months as a percentage of the theoretical maximum (wall clock time times number of processors).

